
ChillerMax (Training)
Agenda
- Chiller Components
- Chiller Refrigerant Cycle
- Using the ChillerMax Website
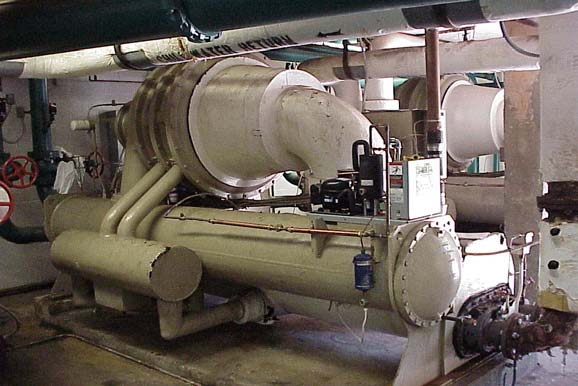
Chiller Components
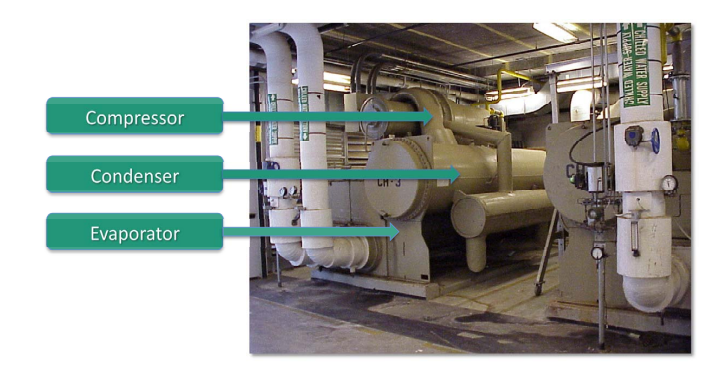
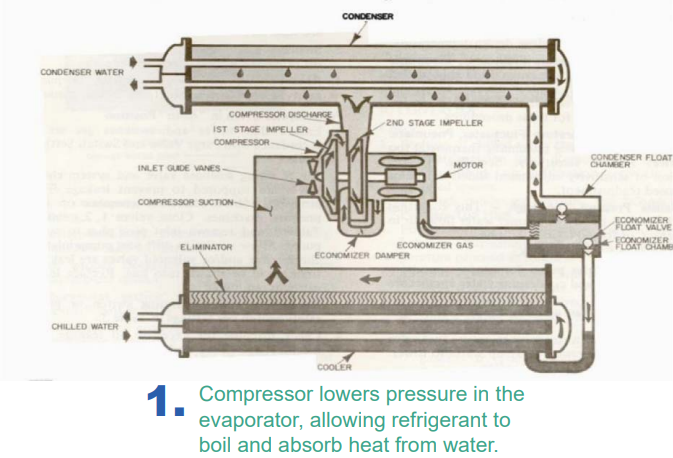
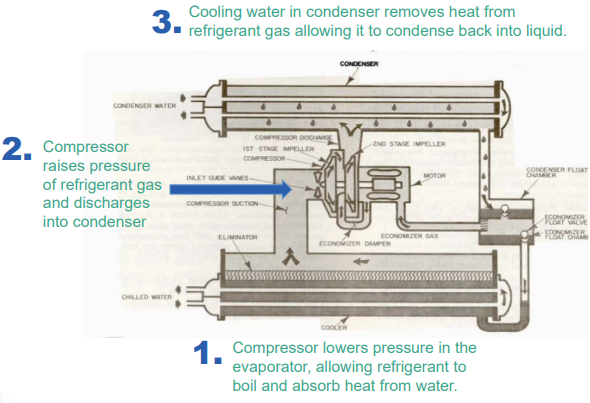
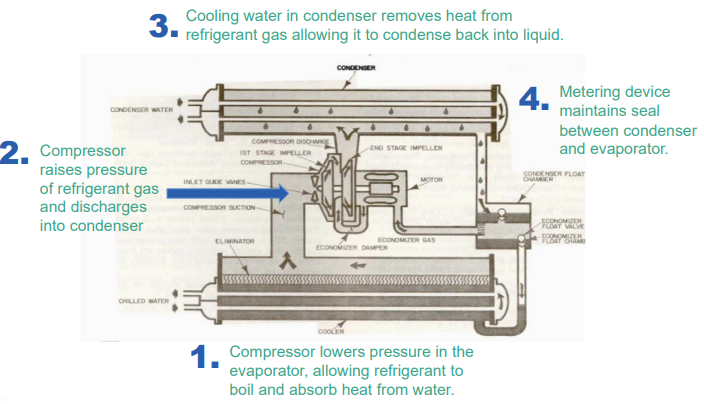
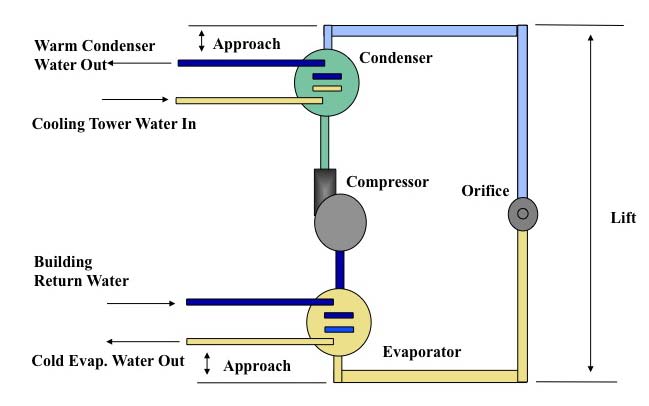
Chiller Refrigerant Cycle

Chiller Efficiency
- Chiller energy is a function of load and lift.
- Lift is the difference between the evaporator pressure and the condenser pressure.
- The greater the pressure difference, the more energy for a given load.
- The lower the pressure difference, the more efficiently the chiller operates.
What Influences Chiller Efficiency?
Importance of Maintaining Chiller Efficiency
- Centrifugal water chillers can account for up to 50% to 60% of a facility’s total energy consumption.
- Centrifugal water chillers can lose as much as 20% efficiency and still appear to be operating satisfactorily.
Cost of Inefficiency
10,000 Ton Chiller Plant:
- Average cost to run chillers = $1,170,000
(Assumptions: .65kw/ton, $0.06kwh, 3.000 EFLH) - Assumint 15% efficiency loss = $1,345,500
$175,500 in Wasted Energy!
Condenser Problems
- Fouled condenser tubes
- Non-condensables
- Division plate problems
- High condenser water temperature
- Low condenser water temperature
- Low condenser water flow
- High condenser water flow
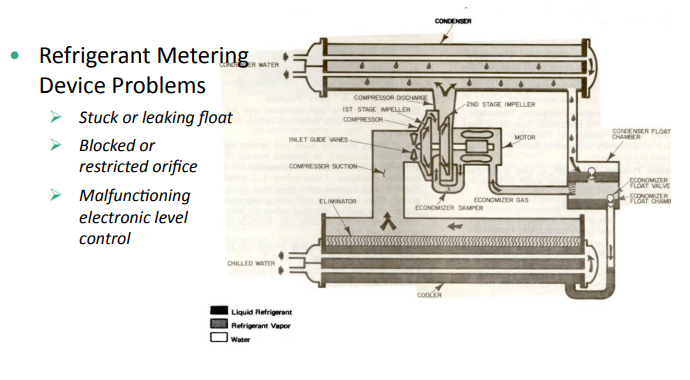
- Metering device problem
Evaporator Problems
- Low refrigerant charge
- Fouled evaporator tubes
- Low evaporator temperature
- Division plate problem
- Low evaporator water flow
- High evaporator water flow
- Contaminated refrigerant
- Metering device problem
Reality of Chiller Plant Operation
- Chiller logs are routinely taken but analysis of the data is difficult and problems may not be identified in a timely manner.
- In many plants, the assumption is made that if the chiller is running and the building is cool, then everything is OK.
Typical Chiller Maintenance Program
- Routine logging using clipboards and log sheets
- BAS monitoring only
- Condenser water temperatures
- Chilled water temperatures
- Amps
- Routine periodic and annual maintenance

Log Readings Alone Are Not Efficient
- On the surface, chillers appear to be reliable and putting out a consistent supply of chilled water.

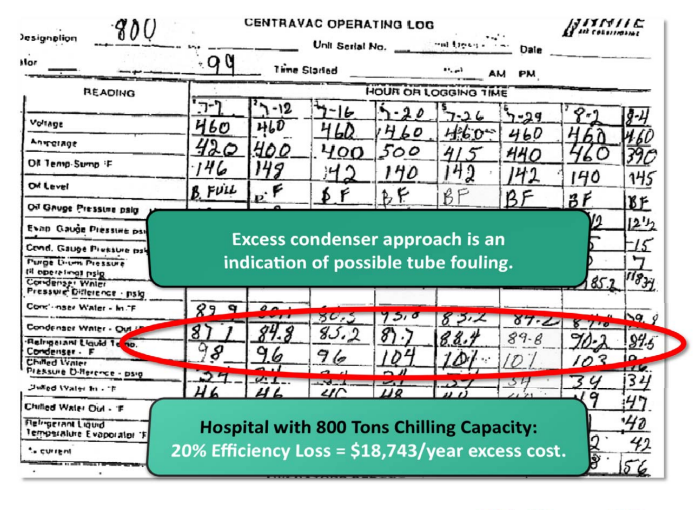
- A well constructed chiller log sheet can reveal problems that cost you money
Chiller Logging
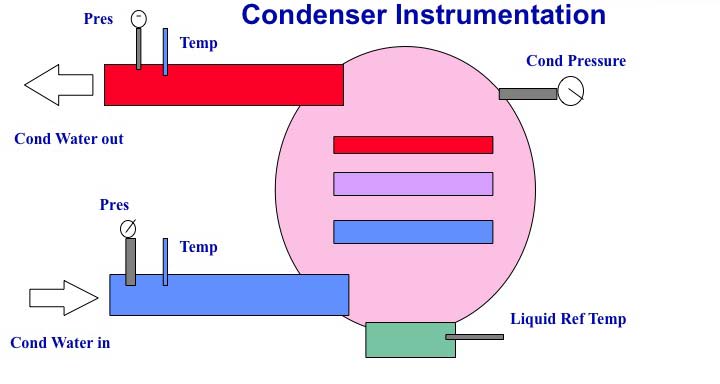
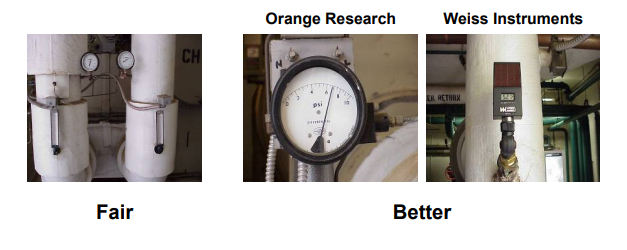
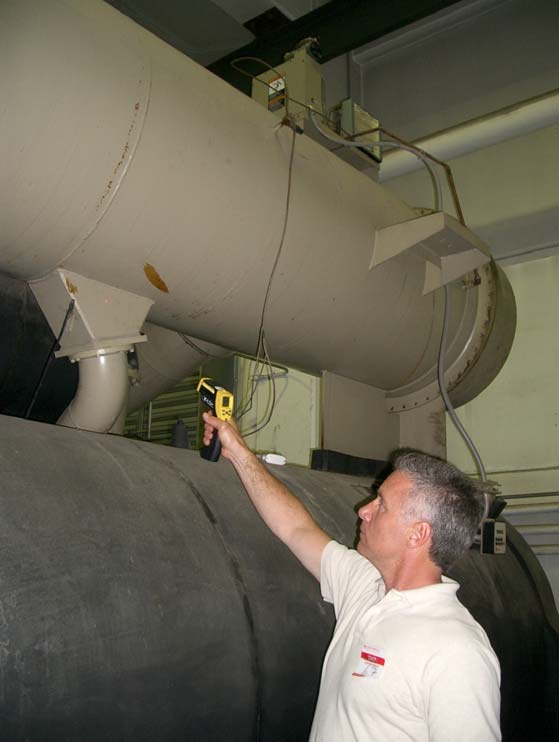
Chiller Instrumentation
- An effective logging program must begin with accurate and reliable instrumentation that is periodically calibrated.
For R-11 & R-123 Low Pressure Refrigerant Chillers
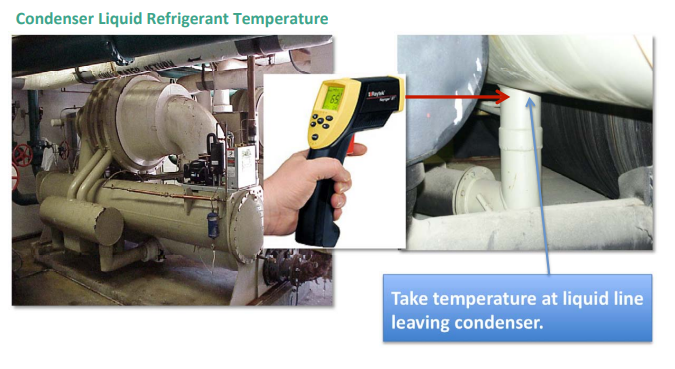
Refrigerant Temperature
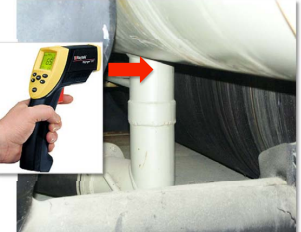
leaving condenser. Recommend
Raytek Model ST 60 or better.
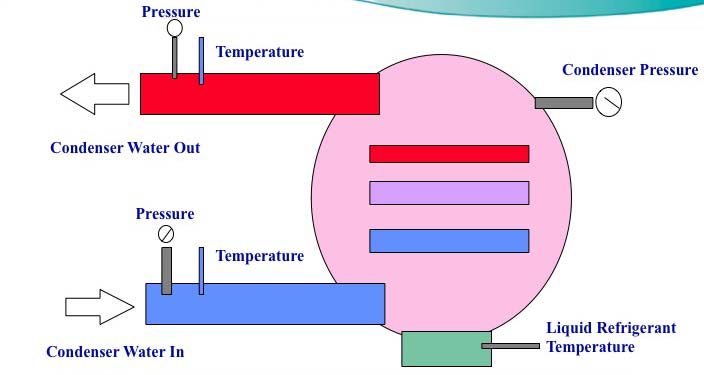
- Condenser Saturated Refrigerant Temperature
- On a low-pressure refrigerant chiller
- R-11 & R-123
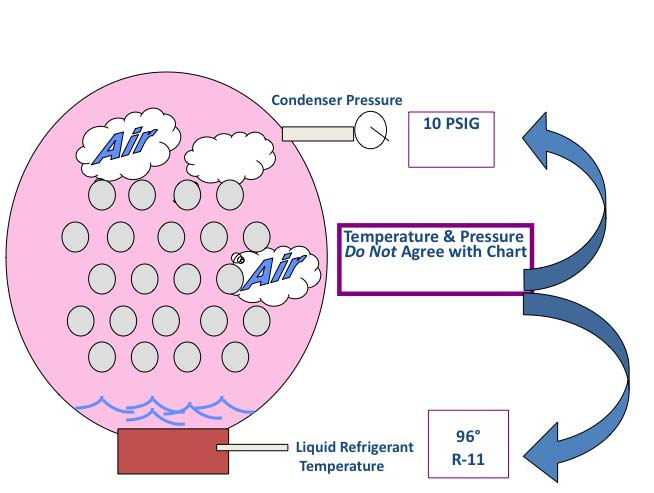
Non-Condensables
Convert liquid refrigerant temperature to pressure. Should equal to condenser pressure.
- R-11 Pressure/Temperature Chart
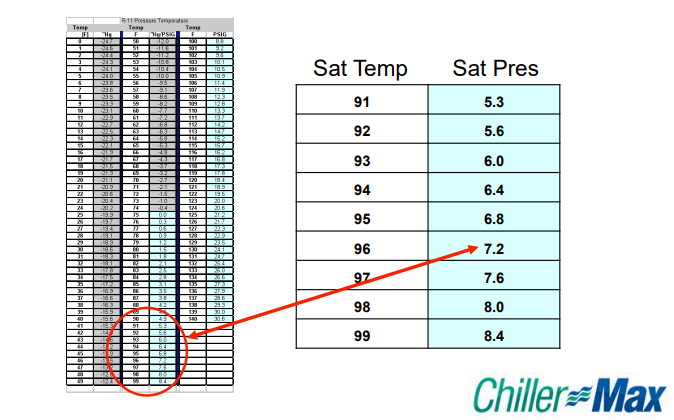
- No Air in Chiller

- Air in Chiller
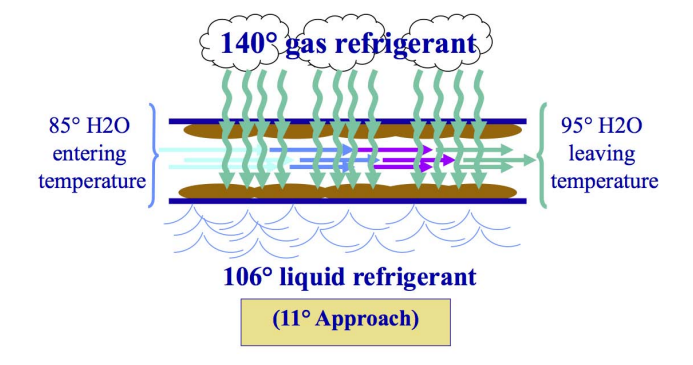
Condenser Approach
- The difference between the condenser water out
- Temperature and the liquid refrigerant temperature.
- Condenser approach should be 0 to 2 degrees (Liquid Refrigerant Termperature – Condenser Water Out)

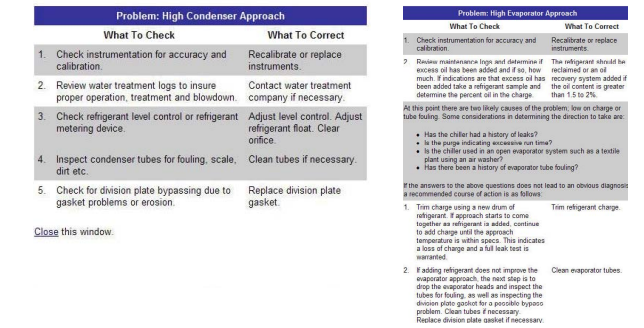
Causes of High Condenser Approach
- Fouled condenser tubes
- Division plate problems
- Blocked condenser tubes
- Refrigerant metering device problems
- Low condenser water flow
- Low condenser water temperature
Note: For every 1 degree rise in condenser approach, the chiller efficiency may decrease by up to 2%
Condenser Approach: Clean Versus Dirty Condenser Tubes
When Tubes Are Clean

High Condenser Approach: When Condenser Tubes Get Dirty
- Scale and fouling act as insulation.
- It takes more energy to raise water temperature.
- Your chillers waste energy.
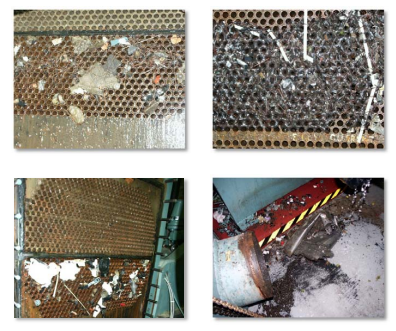
Tube Fouling: When Condenser Tubes Get Dirty
High Condenser Approach

- Blocked Condenser Tubes
Water Flow Problems
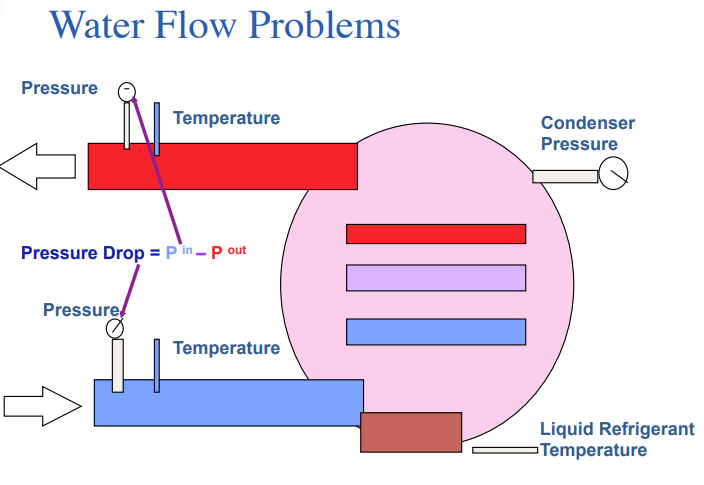
Low Condenser Water Flow
- As condenser water flow decreases, the temperature rise across the condenser increases.
- If the flow decreases by 30%, the temperature rise increases by 30%.
- Chiller efficiency decreases by up to 2% for every 1 degree rise in leaving condenser water temperature.
Calculate Flow Actual Versus Design
(GPMactual/Gpmdesign)2 = PDa/PDd
GPMa = √PDa/PDd x Gpmdesign
Design Gpm = 2000gpm @ 10psi pressure drop.
Actual PD = 5psi
Gpma√5/10×2000 = .707×2000 = 1414 Gpm
1414 Gpm = 30% reduction in flow and 30% increase in temperature rise.
High Inlet Condenser Water Temperature
Most chillers are designed for a max condenser inlet water temperature of 85 degrees F. If the entering condenser water temperature exceeds 85 degrees, the efficiency of the chiller is reduced by as much as 2% per degree above 85 degrees.
Evaporator Instrumentation
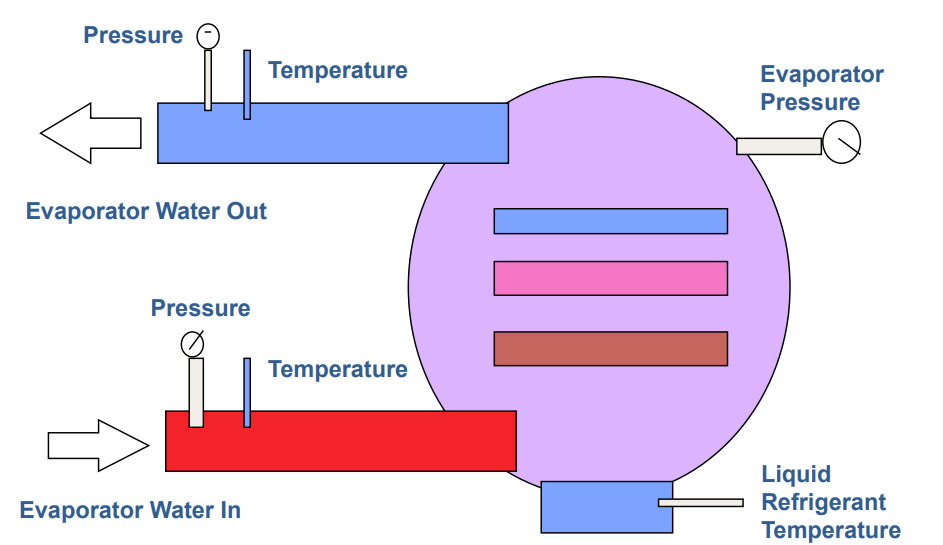
Evaporator Approach Problems

High Evaporator Approach Can Be Caused By
- Low refrigerant charge
- Fouled tubes
- Contaminated charge
- Division Plate Problems
- Flow problem
- Metering device problem
Low Evaporator Set Point
All chillers are selected for a leaving water temperature required to satisfy design conditions. If a chiller is operated with leaving evaporator water temperature lower than design, more energy is required. It takes up to 2% more energy for every 1 degree lower set point.
Compressor Instrumentation
- Amps
- Volts
- Oil gauge pressure
- Oil temperature
- Oil level
- Purge Data

ChillerMax: The High-Tech Solution
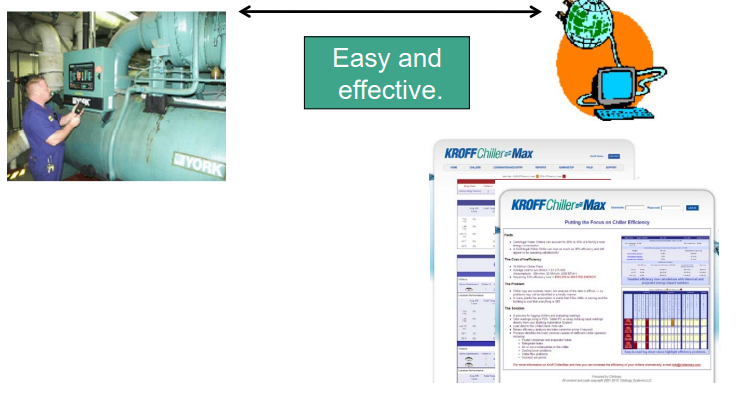
- Operator visits all operating chillers and collects data on a daily basis
- Operator hot syncs with the website for chiller report or using Autolog, log data can be entered directly from a BAS system
- Problems are identified and quantified by source
- Corrective actions are given and scheduled
- Efficiency is restored or maintained
ChillerMax Identifies Problems
- Fouled condenser or evaporator tubes
- Loss of refrigerant charge
- Cooling tower problems
- Water flow problems
- Non-condensables in the chiller
- Incorrect chilled water or condenser water temperature set points
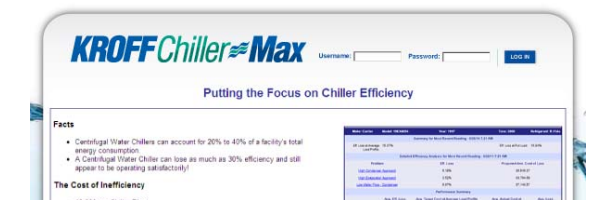
Using the ChillerMax Website
Logon to ChillerMax Website using Username and Password Provided
Logon at www.chillermax.com
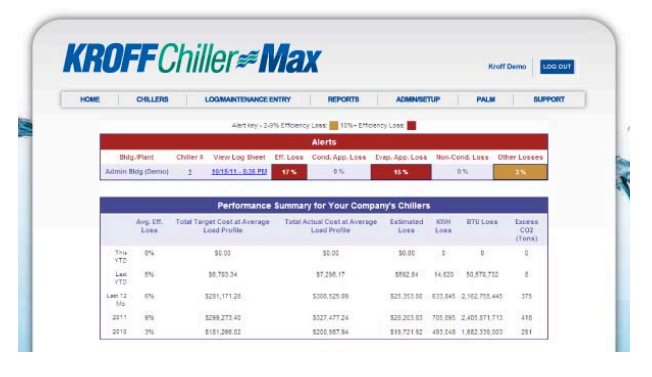
Chiller Dashboard
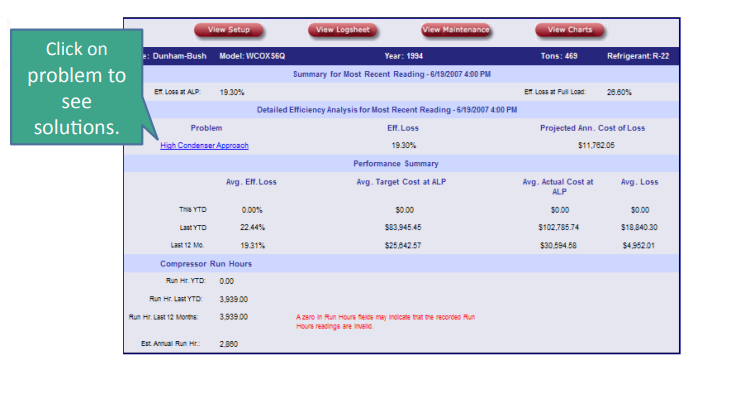
Solutions
Review the possible solutions to the problems indicated. If necessary, discuss with subcontractor such as water treatment or mechanical services contractor.
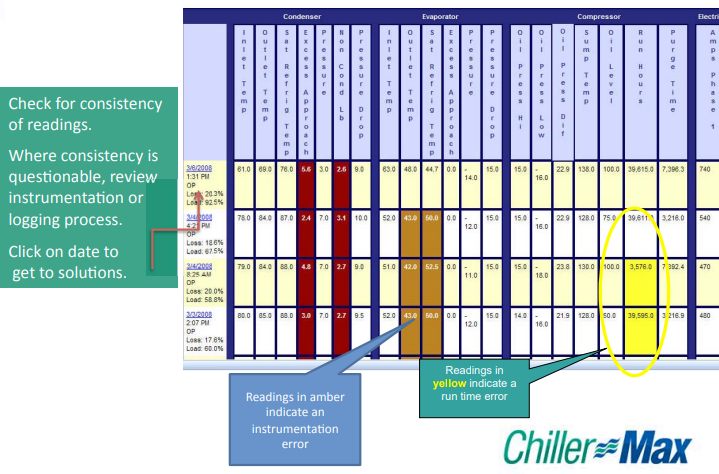
Logsheet View
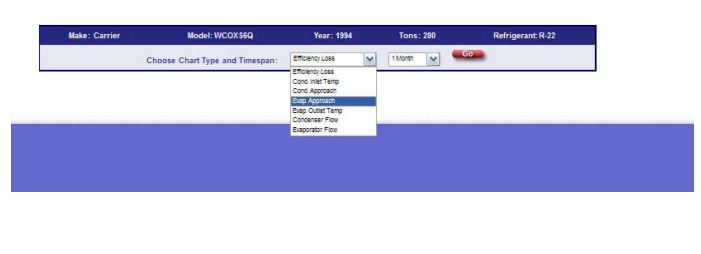
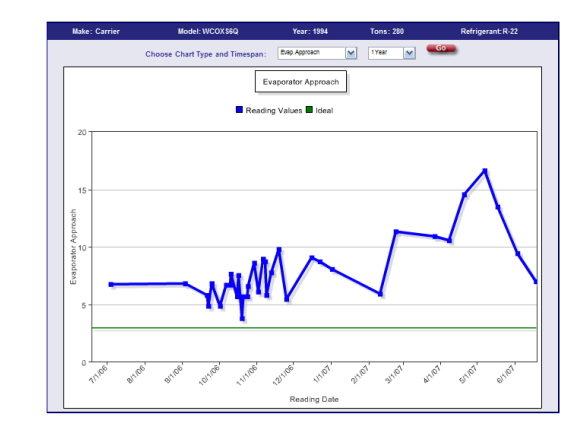
View Charts
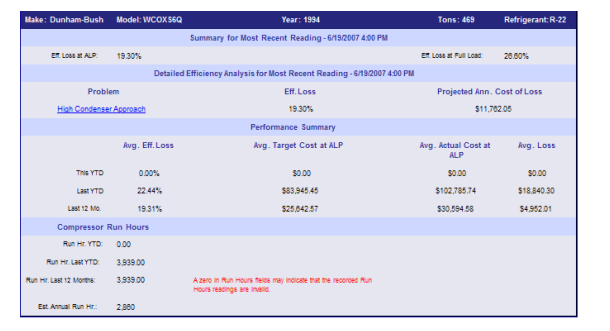
Chart Trends
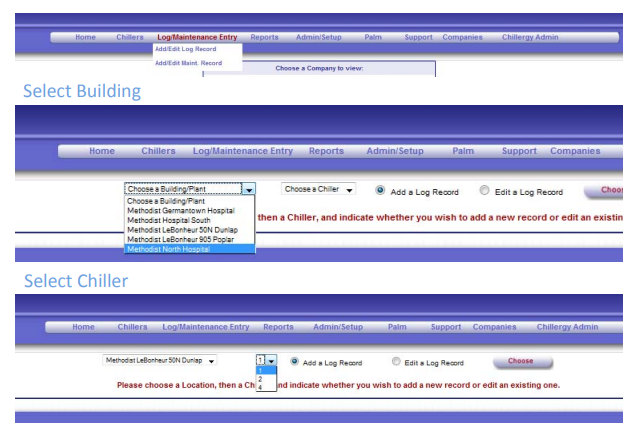
Logging Chillers Using ChillerMax
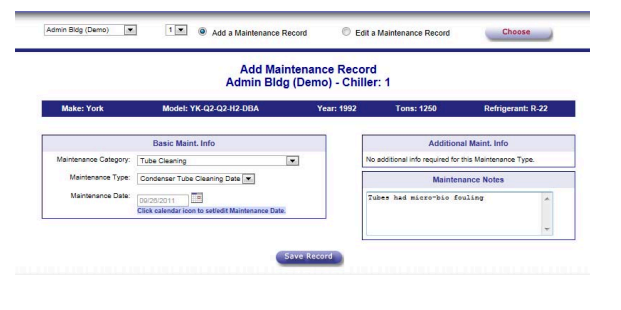
Add Log Record
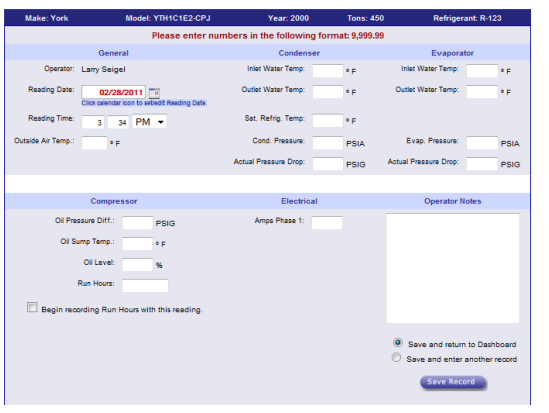
Enter Required Data
Digital Control Panels
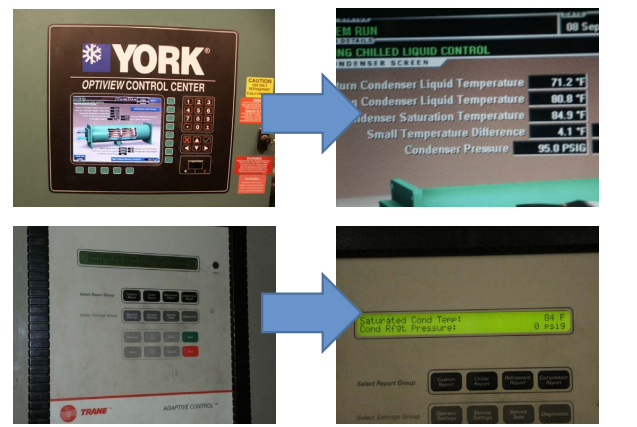
Condenser and Evaporator Readings

For R-11 & R-123
Low Pressure Refrigerant Chillers
Compressor and Electrical Readings

Using ChillerMax to Track Maintenance Tasks
Condition Based Maintenance
- Maintenance tasks assigned based on need, not on arbitrary schedule such as:
- Tube brushing
- Leak response
- Oil changes
- Can result in significant reduction in annual maintenance costs.
Example: Emory University
- Chiller “annual maintenance” costs reduced by identifying tasks required based on operational parameters.
- Condenser tube brushing reduced from 38 chillers per year to 15 chillers in 2003 and 8 chillers in 2005
- One oil change required in 2003
Internally Enhanced Tubes
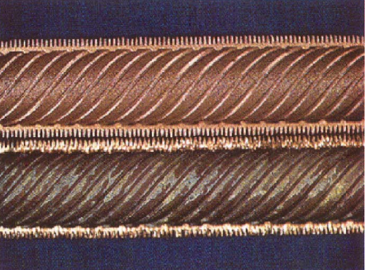
Dirty Tube

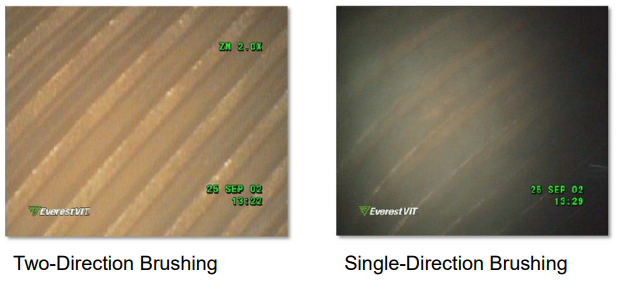
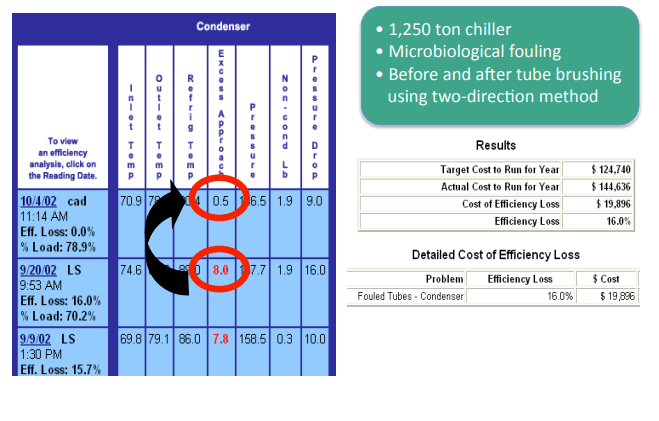
Two-Direction Versus Single-Direction Tube Brushing
ChillerMax Identifies Problems
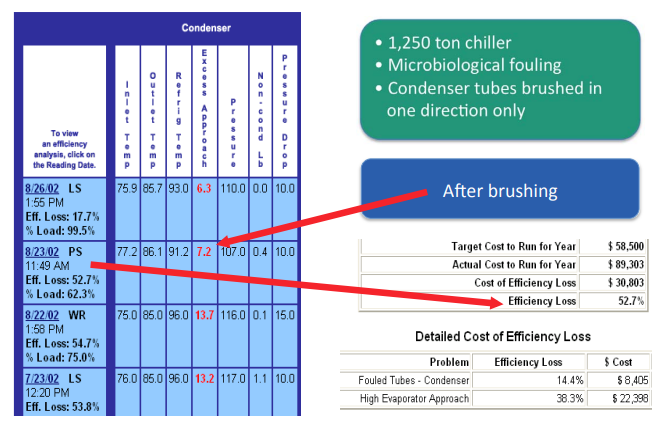
ChillerMax Restores Efficiency
Lessons Learned with Internally Enhanced Tubes

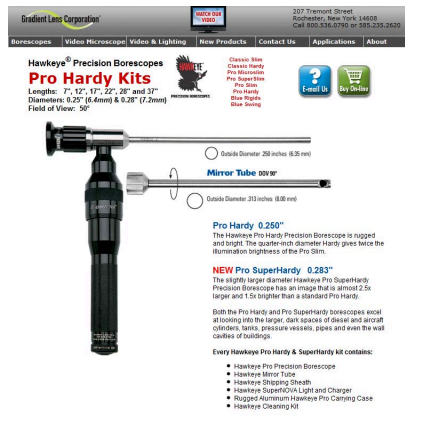
Use Borescope to Inspect Tubes

Questions & Answers.
For additional information contact:
Don Tomovich
302-753-7940
[email protected]